YHOO! Charts is here!!
We heard eons ago of Yahoo! coming out with its Web2.0 finance portal to counter the new kid on the block a.k.a. the undertaker a.k.a. Google boy. The beta is here (only chart for now). And, it looks sexy! Looks very professional and to the extent of services provided by paid brokers.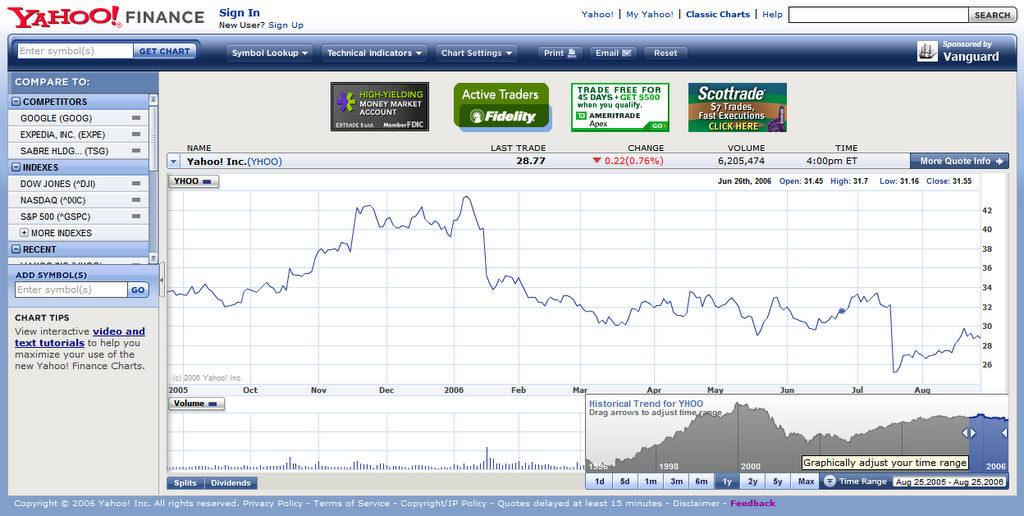
For some reason it worked really well on a wide display computer with IE 6 but the display was haywire on a smaller display with IE 7. Note: Did not have the option for FF. IE wins again!
Now, what I liked:
- Ability to add other symbols and compare them on the same chart a la a-2-a (apple-to-apple)
- Good display of splits and dividends (on-demand)
- Under Technical Indicators menu there is a slew of options (confession: I stayed with the default, could not make a head or tail of remaining.)
- User-friendly and good experience
- Can collapse left panel to occupy whole screen with the chart only
- Time range can be specified manually or dragging
What I did NOT like:
- It only is the chart misses out the conciseness of Google Finance (Guessing rest is to follow)
- I need news/events with hovering mouse over, just like Google's, this I think is the biggest miss IMHO, that was a killer by Googly
Yahoo! has a lot more data and experience in this field and I would want to see more from them. Wondering what MSN is upto.
Related posting: New front for GOOG.
PS: Keep an eye on Zoho, this is one bad boy. IMHO, they have probably assembled the best office suite online in Web2.0 era.
1 comments:
Thanks for taking note of Zoho, Zeya!
Post a Comment